FabFilter Pro-MB online help
Table of contents
Go to sectionFabFilter Pro-MB Help
Introduction
Using FabFilter Pro-MB
Full Screen mode, resizing and scaling
Presets
Purchasing FabFilter Pro-MB
Support
Display and workflow
The large display provides an overview all bands and lets you easily create new bands and edit them. Each band visualizes its potential dynamic range, while the thick yellow curve shows the overall dynamic frequency response at the present moment.
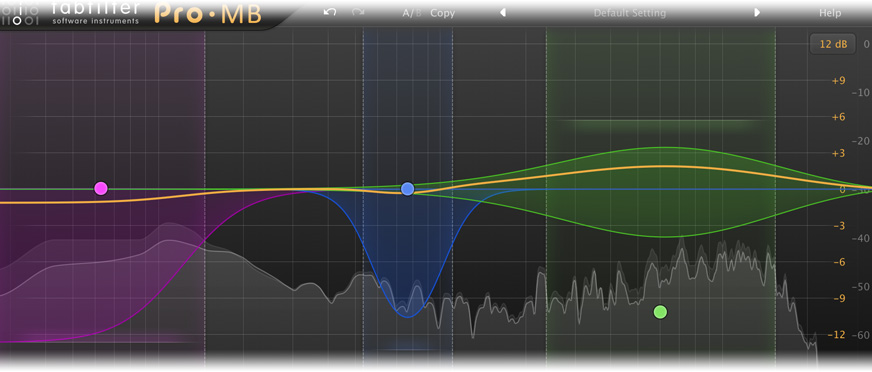
Unlike traditional multiband tools, the unique workflow in FabFilter Pro-MB does not require you to divide the entire spectrum in bands. You just create one or more bands at the frequency range that you actually want to work on, and leave the rest of the spectrum unprocessed. We take care of the rest!
Creating bands
- To create the first band, just click anywhere in the display. The band is created with a default width, but you can adjust this with the mouse wheel as you hover over the display.
- To create more bands, hover over an empty area or over an existing band in the display and click the + button at the top.
- Alternatively, you can drag the yellow overall curve or double-click in an empty area.
After creating a band, you can immediately start dragging to adjust it.
Selecting bands
- Click anywhere inside a band to select it.
- Click and drag on the display background to select adjacent bands by dragging a rectangle around them.
- Alternatively, hold down Ctrl (Cmd on macOS) and click another band to select multiple bands. Hold down Shift and click a band to select a consecutive range of bands.
- Click once in an empty area to deselect all bands.
Adjusting and editing bands
- Click the peak dot in the center of a band and drag vertically to adjust the gain, or horizontally to adjust the center frequency. All selected bands are adjusted in parallel. As you move a band across the spectrum, the other bands are squashed and then moved as well to make space.
- Use the mouse wheel or hold down Ctrl (Cmd on macOS) and drag vertically to adjust the width of a band.
- Hold down Shift while dragging to fine-tune the settings of the selected bands.
- Normally, dragging is constrained to either a horizontal or a vertical adjustment. To bypass this and drag freely in both directions, hold down Alt while dragging.
If you move a band close to another band, it will snap to it, and they will start sharing a single crossover. Likewise, you can also snap a band to the display edge. If you want, you can use this to divide the entire spectrum in bands for a more traditional approach to multiband processing.
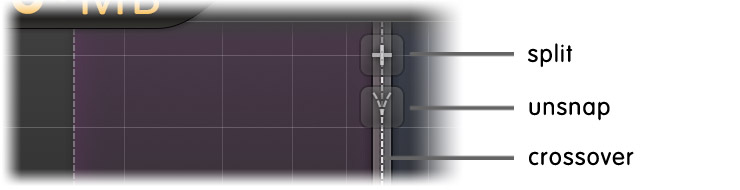
When hovering over a snapped crossover line, two buttons appear. The Split button creates a new band between the two snapped bands. The Unsnap button unsnaps the two bands, creating a small empty area in between. This lets you move them independently again.
When you hover the mouse over a band, additional controls appear in the display:
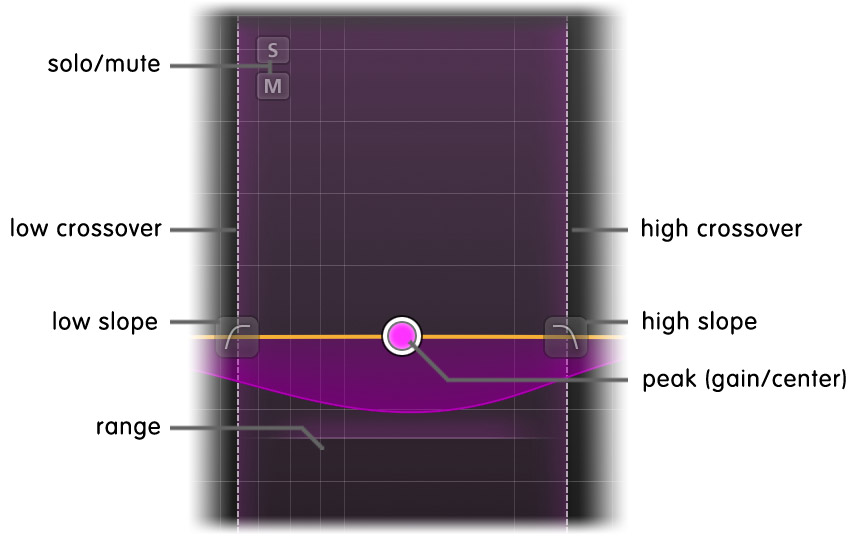
- The solo/mute buttons enable you to mute a band or listen to it exclusively. Hold down the solo or mute button to solo or mute a band only temporarily, as long as the mouse button is pressed, To solo or mute a band exclusively, Ctrl-click (Windows) or Cmd-click (Mac) the solo or mute button.
- The crossover lines let you drag each crossover independently. In contrast, dragging the peak dot horizontally changes the center frequency, adjusting both crossovers in parallel.
- The slope buttons set the low and high crossover slope for the band. Each crossover can have an independently variable slope value from 6 dB/oct to 48 dB/oct. To change multiple slope values at the same time, click and drag a rectangle around the slope buttons to select more than one.
- The range line lets you easily adjust the Range parameter for a band by dragging the line up and down.
In the top-right corner of the display, there is a drop-down button to choose the display range: +/- 3 dB, 6 dB, 12 dB or 30 dB. When you are dragging a curve outside the current range of the display, the range will expand automatically as needed.
Horizontal zooming
Sometimes it might be useful to zoom in to a specific frequency for extra precise editing. You can easily do this by clicking and dragging the frequency scale at the bottom of the display, just above the bottom bar. You can do the following:
- Click and drag up and down to zoom in and out at the frequency you have clicked on.
- While zoomed in, you can also drag left and right to move the frequency scale.
- Just double-click the scale to return to its default full range.
Tips
- In Full Screen mode, available via the button at the right top of the interface, the display will fill the whole screen so you can make very precise adjustements. See Full Screen mode and resizing.
- You can turn off the automatic adjustment of the display range by clicking Auto-Adjust Display Range in the Help menu.
- Note that two display scales are drawn: the yellow scale is adjusted by the Display Range drop-down button and corresponds to the band curves, range and the yellow overall curve. The gray scale is used by the spectrum analyzer and output level meter.
- You can double-click the crossovers, slope buttons and range line to enter a value with the keyboard. When you double-click the peak dot, you start editing the gain of the band; press Tab or double-click on the center frequency in the parameter value display to edit the center frequency instead.
Next: Basic band controls
See Also
Overview