FabFilter Saturn 2 online help
Table of contents
Go to sectionFabFilter Saturn 2 Help
Introduction
Using FabFilter Saturn 2
Interactive multi-band display
Drag-and-drop modulation slots
Full Screen mode, resizing and scaling
Presets
Purchasing FabFilter Saturn 2
Support
Modulation visualization
FabFilter Saturn 2 contains advanced modulation visualization features which greatly help you to understand the effect of the modulation that is going on. In the plug-in interface, modulation is visualized in three different ways: the effect of applied modulation to controls is shown by real-time target level indicators, the global amount and direction of modulation generated by sources is visualized in the source flow area, and finally, current connections by different types of sources are made clear by the modulation indicators next to target controls.
Target level indicators
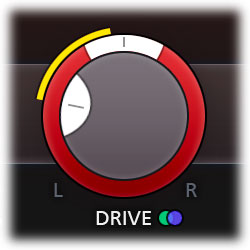
All modulation that is applied to a control in the interface is shown in real-time via target level indicators around knobs, sliders and other controls. The level indicator originates from the current knob/slider position, and shows the range of modulation: it visualizes how the knob is dynamically changing due to the current modulation signal.
The color of the target level visualization matches the type of source that modulates it. Note that if a target is modulated by multiple types of sources, a generic yellow color is used instead.
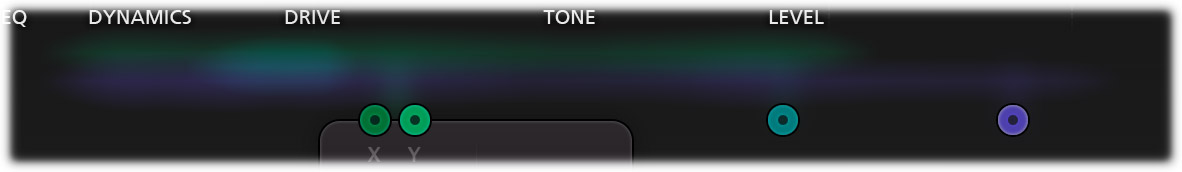
The source flow area
In the area right above the modulation sources, the signal being produced by the sources is visualized in real-time by a diffuse flow, directed towards the targets it is currently modulating. This visualization gives you a global idea of the current activity and effect of sources. It is not intended to show all connections exactly, as this would highly clutter the interface and would probably be more confusing than helpful.
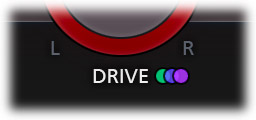
Modulation indicators
When a control is modulated, a small modulation indicator dot appears near the control. The color matches the source that modules the control. If multiple types of sources modulation a control, the modulation indicator consists of multiple colored dots.
When a modulation indicator appears in the interactive multi-band display or in an envelope generator, this means one or more parameters are modulated. When you click the indicator, the modulation slot panel that pops up shows all slots that modulate one of these targets.
Tips
- Click on a modulation indicator next to a target control or on a control itself, to pop up the modulation slot panel, showing all associated modulation slots. Click the control again, or click on the interface background, to hide the modulation slot panel.
- Are you seeing yellow colored target level visualization? This means that the target is modulated by multiple types of sources at the same time.
- In case you find the source flow visualization distracting, click the large + button in the modulation section, and uncheck the Show Source Flow option at the end to turn it off.
Next: XLFO
See Also
Overview