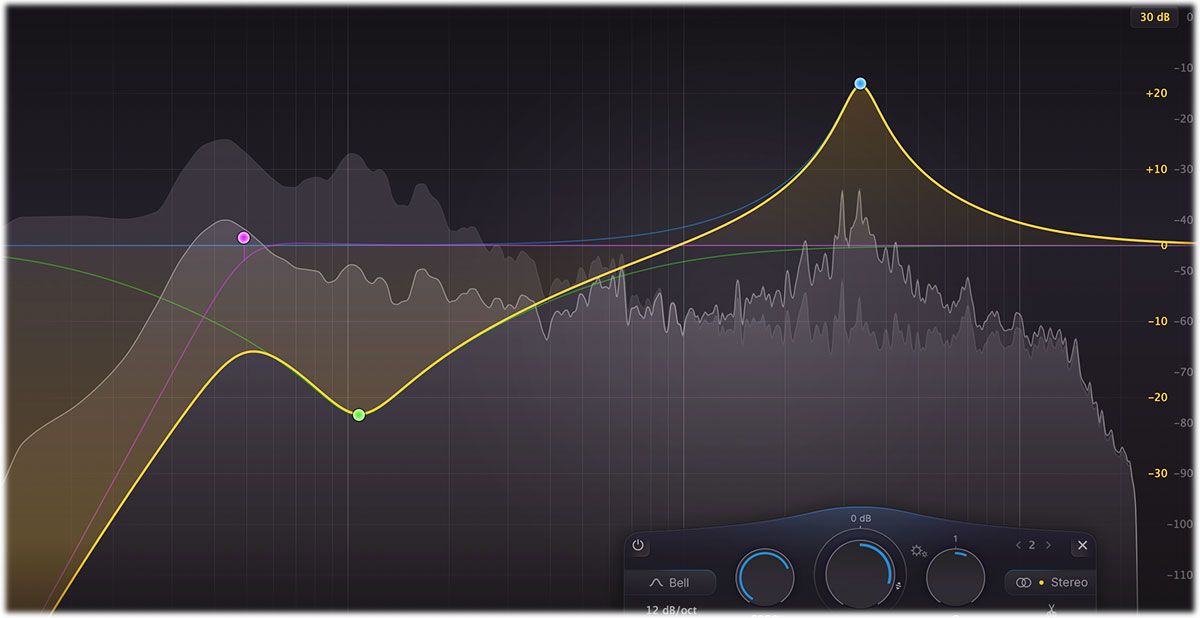
To help you judge the effect of the combined EQ bands on the incoming audio signal, FabFilter
Pro-Q 3 includes a powerful real-time frequency analyzer.
The spectrum analyzer can be customized via the analyzer panel, which pops up
automatically when you hover above the analyzer button in the bottom bar. It offers the following
options:
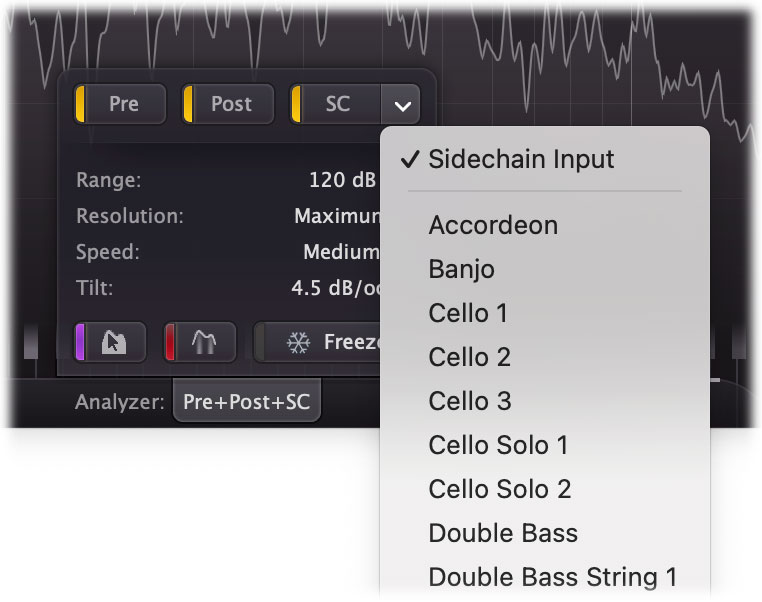
The Pre and Post buttons at
the left top of the analyzer panel enable or disable the pre- and post-EQ
spectrum visualization. Note that when global bypass
is enabled, the plug-in won't receive or handle any audio, so the spectrum analyzer is disabled
as well.
The instance name label shows the name of this Pro-Q 3 instance. In most DAWs, this name will be based on the name of the track at which Pro-Q 3 is inserted. You can choose a custom name if you want by double-clicking the instance name label.
In addition, you can visualize an external spectrum in the main EQ display: this can be either the external side chain of the plug-in, or the post-EQ spectrum from any other Pro-Q 3 instance, as shown in the list of external spectrums. Simply click an external spectrum in the list to activate it. It will be shown in the EQ display with a light red outline to distinguish it from the regular pre- or post-EQ spectrum.
The Freeze button at the left bottom of the panel causes the spectrum to stop falling and build up a maximum over time. While Freeze is enabled, a blue line at the top of
the Analyzer button in the bottom bar indicates this state as well.
The Spectrum Grab button next to the Freeze button enables or disables the Spectrum
Grab feature. If enabled, you can leave the mouse above the spectrum for a few seconds, and
Pro-Q will automatically enter Spectrum Grab mode. Existing EQ bands will be dimmed while the
spectrum freezes. You can now simply grab one of the peaks in the white output spectrum line,
and drag to adjust! See Spectrum Grab.
The Show Collisions button enables or disables frequency collision indication. When enabled, the main analyzer will highlight areas of the spectrum (using a red glow) where frequencies may collide with frequencies of the currently selected external spectrum, possibly causing auditory masking issues. In addition, similar highlighting is shown in the list of external spectrums (the side chain and other Pro-Q 3 instances) so you can easily browse for possibly clashing signals. Note that this is merely an indication, and not exact science. Always use your ears to decide whether you are actually dealing with problematic collisions or frequency masking. To properly detect peaks and collision areas in the low frequencies, it's best to use the High or Maximum analyzer resolution setting.
Hover above (or click on) the Settings button to open a panel with settings to customize the behavior of the real-time spectrum measurements:
The Range setting specifies the vertical range of the spectrum analyzer,
which can be 60 dB, 90 dB (the default setting) or 120 dB.
The Resolution setting determines how precise the spectrum analyzer works.
Higher resolution settings allow more precision in the low-frequency area, but because more
incoming samples are needed to calculate a single spectrum, the update rate will be lower which
generally results a slower attack time. The Low value corresponds to a
resolution of 1024 points, Medium to 2048, High to 4096, and Maximum to 8192 points.
The Speed setting selects the release speed of the spectrum. A fast
release shows dynamic changes more clearly, while a slow release gives you more time to examine
the spectrum before it disappears.
The Tilt setting tilts the measured spectrum around 1 kHz with a specified
slope, expressed in dB per octave. The default setting of 4.5 dB/oct results in a natural
looking spectrum, resembling best how loudness is perceived by the human ear.
Clicking the EQ Match button will invoke EQ Match mode. This is a two-step
process that uses the side-chain and post-EQ spectrum analysis and adds EQ bands to match the
side-chain characteristics. See EQ Match.
Horizontal zooming
Sometimes it might be useful to zoom in to a specific frequency. You can easily do this by
clicking and dragging the frequency scale at the bottom of the EQ display, just above the bottom
bar. You can do the following:
Click and drag up and down to zoom in and out at the frequency you have
clicked on.
While zoomed in, you can also drag left and right to move the frequency
scale.
Just double-click the scale to return to its default full range.
Tips
When you hover over the display, or move the mouse slowly, the frequency under the mouse cursor is shown in the frequency scale at the bottom of the display. If the piano display is enabled, the key under the mouse cursor is highlighted. You can turn this feature on or off by clicking Show Frequency On
Hover in the Help menu.
To properly detect peaks and collision areas in the low frequencies, it's best to use the High or Maximum analyzer resolution setting.
If the dark red color used for frequency collisions is hard to see for you, click Use Accessible Colors on the Help menu to toggle to a brighter color.
When skipping through presets, the current analyzer settings are not changed, but they are
saved in songs.
Hold down the Freeze button to freeze temporarily until you release the mouse button
again.
If desired, you can make the analyzer panel 'sticky' by clicking the Analyzer button once.
Click it again to hide the panel.